Photometry with the SeeStar telescope using ASTAP for processing
The SeeStar telescope features a One-Shot Color (OSC) sensor. To prevent star trailing in images, the typical practical maximum exposure time is 10 seconds.
For
effective photometry, given the sensor's Bayer pattern, it is essential
to slightly defocus stars to achieve a Half-Flux Diameter (HFD) of
approximately 8 to 10. This technique offers two key benefits:
1. It creates a flatter star profile, ensuring that each star illuminates several red, green, and blue-sensitive pixels.
2. It helps prevent star saturation.
Image Format and Processing:
For
this workflow, images must be saved in raw format, which preserves the
original, unprocessed data from the sensor. A raw image contains a
Bayer pattern—a 2x2 grid of pixels with one red, two green, and one
blue-sensitive pixel. While these pixels are later combined to produce
a color image, a different approach is used for photometry.
The
raw image can be digitally separated into three distinct monochrome
channels: red, green, and blue. This process, known as "debayering" or
"channel extraction," results in three separate grayscale images. In
each image, the pixel values represent the intensity for that specific
color channel. Note that this separation reduces the resolution of each
channel image by half (e.g., from 1080 x 1920 to 540 x 960). These
individual channel images are then used for precise photometric
analysis.
For a visual guide, please refer to the accompanying Yutube video.
1)
Collect exposures 10 seconds. with a HFD value of around 8 to 10. You can
test the HFD of the stars by loading an image in ASTAP and press F4
button. Do not try to measure anything fainter then magnitude 12. The errors become pretty large (8 bit processing?)
| SeeStar photometry | HFD raw frame (1080x1920 pixels) | HFD green frame (540x960 pixels)
| Magnitude limitation for 10 sec exposure (green extract) | Magnitude limitation (for 10x10 sec stacked green extract) | Photometric results (Green (TG)) |
| Defocused | 11 | 6.8 | ≈ 11 | ≈ 12 | Good |
| Focused | 2.6 | 2 | ≈ 13? | ≈ 14? | Poor, unstable values |
2) Load files in the photometry tab. (ctrl+A or
Σ button)
- Select mode "Measure all anotated"
- Select "Gaia comp stars : Online Gaia"
- Aperture 1.8 or 2.0.
- Annulus 4,5 or 6.
- Saturation level, set value around 60000 and check-mark the option saturation level. This will detect saturated stars.
- Recommended: Select in tab alignment Star database =V50 (to be installed)
3) Check the frames with the
Analyse button or analyse
+ button. You can view the image by double clicking on the file.
4) Extract the red
(TR), green (TG) and blue (TB) channel from the selected images by
first selecting all files and then using popup menu of the photometry
tab.
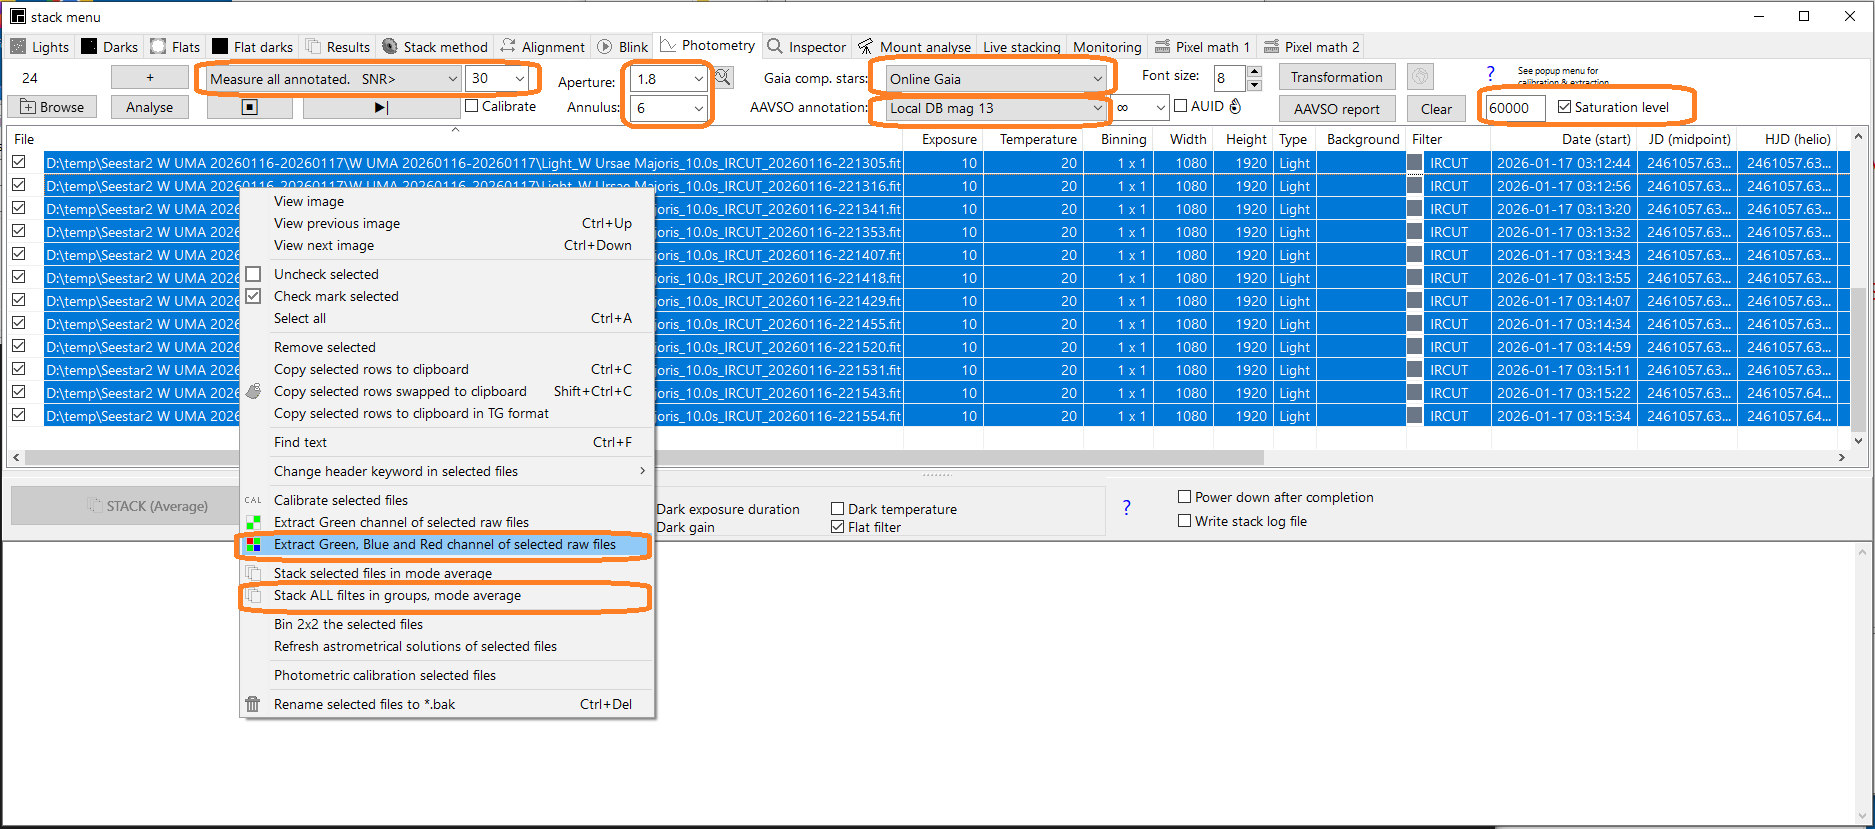
5) Stack in groups of 8 or 10 images using the same popup menu of the photometry tab. Notes: The program will complain about missing dark & flats.
You can ignore these messages. For the SeeStar the darks are already
applied by the telescope software. If the images do not align all
proper and some image are ignored then try again by setting the
align methode "Astrometric alignment" in tab alignment,
6) Press the
⯈|
(play)button to measure all images
7) Press AAVSO
report to open
the report window. In
the
report window select one or more variables, one check star
and several comparison stars if possible. More then one
comparison star improves the measurement. .
8) If it all looks correct, click on create the report. If you see an
outlier, you can use the graphic pop-up menu to select the corresponding
image to inspect.
.
Optionally,
if you measured previously the transformation factors you can
improve the measurements by activating the check-mark transformation.
.
To improve the measurement try transformation.
First you have to image a standard field to measure the transformation
coefficients. Use only stars brighter or equal then magnitude 12.